本人环境介绍
1 | ubuntu 14.04 |
1、ELK安装
elasticsearch下载地址:https://www.elastic.co/cn/downloads/elasticsearch
kibana下载地址:https://www.elastic.co/cn/downloads/kibana
Logstash下载地址:https://www.elastic.co/cn/downloads/logstash
elasticsearch和kibana配置就不多说了,比较简单。
2、logstash的配置
新建syslog.conf文件,此版本的paloalto的有50多个字段,暴力配置如下,所有转发过来的日志直接丢到elasticsearch里面,最后用kibana展示
启动logstash:nohup ./bin/logstash -f syslog.conf &
1 | input{ |
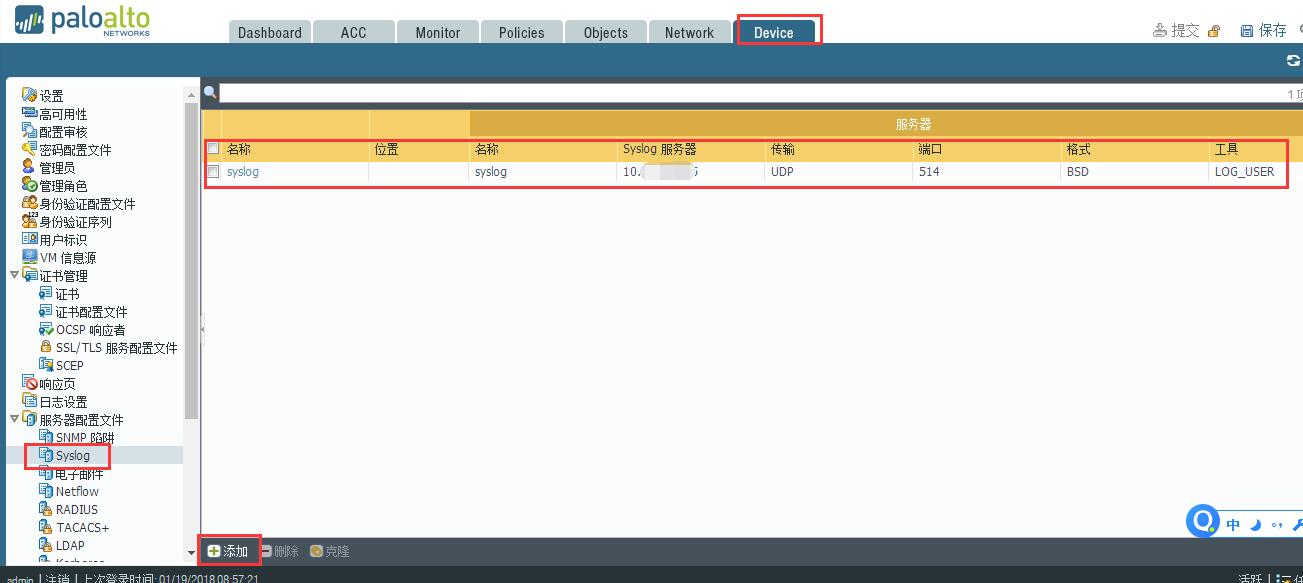
3、paloalto设置
一共有寄个地方要注意一下,否则日志转发不成功
1、创建syslog,转发到logstash服务器
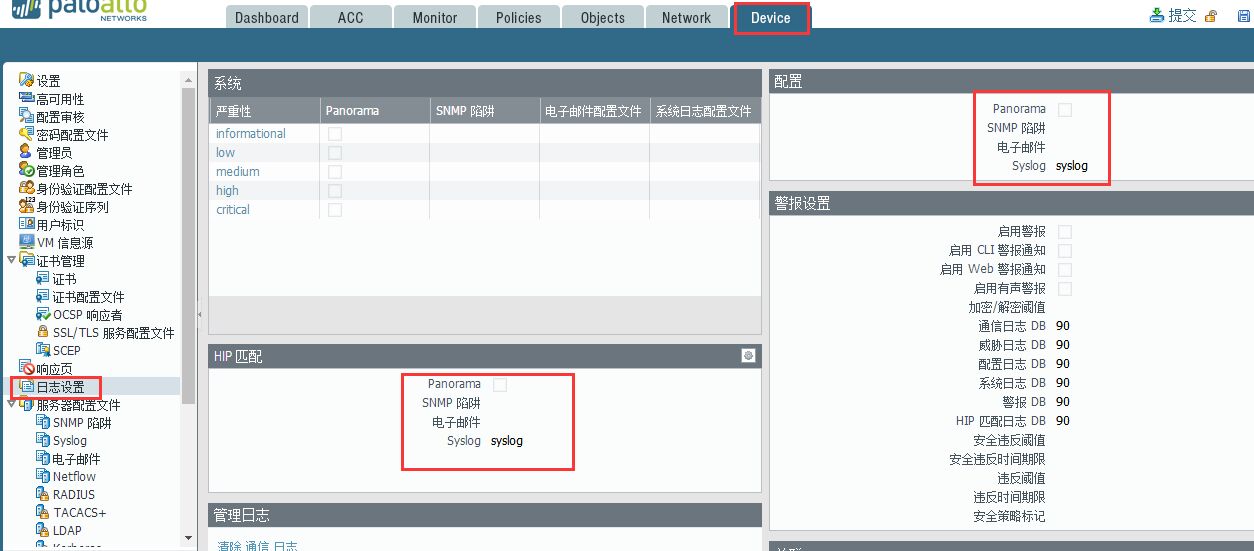
2、配置转发用syslog
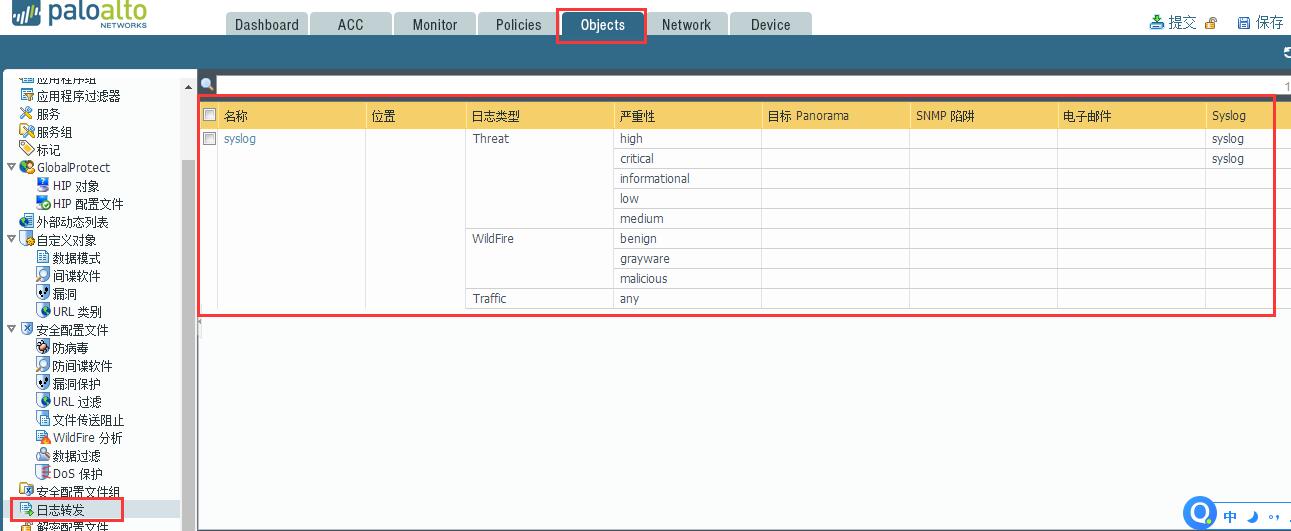
3、配置你想要的日志类型和严重性
4、在安全策略出匹配设置的日志转发
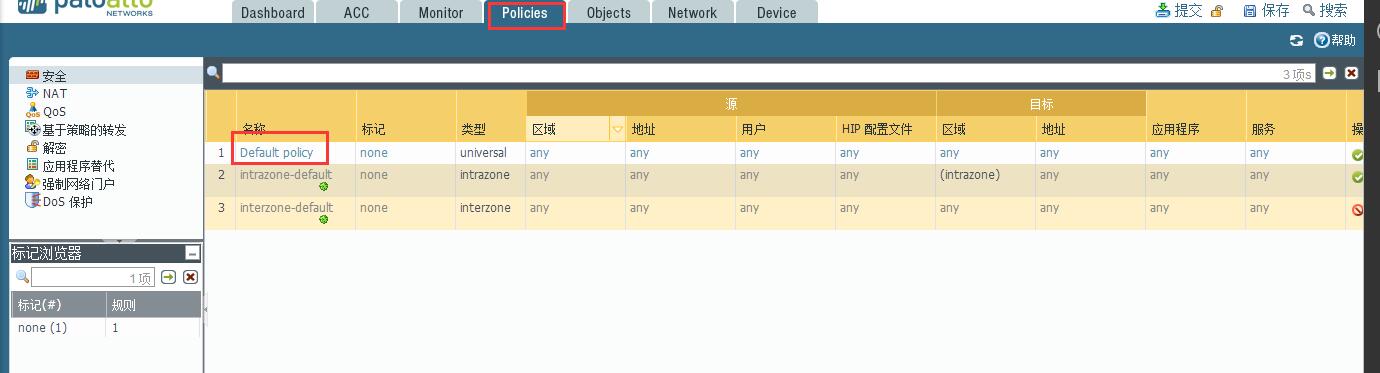
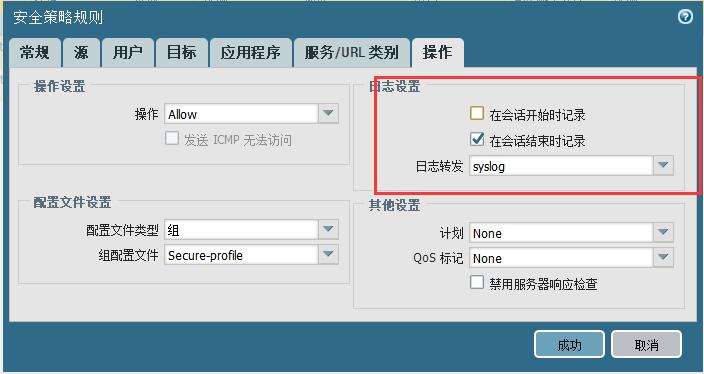
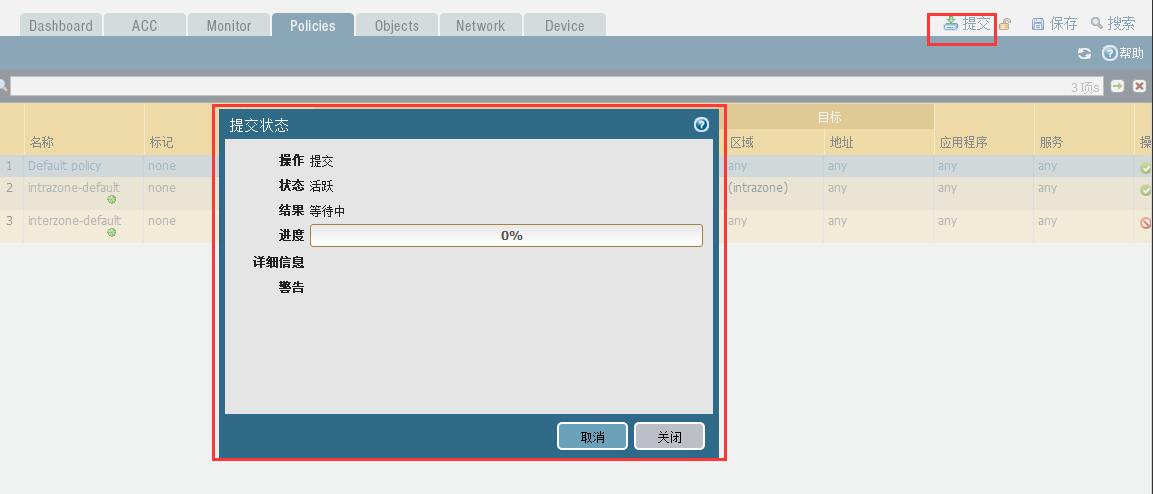
5、最后记得提交配置,否则不生效
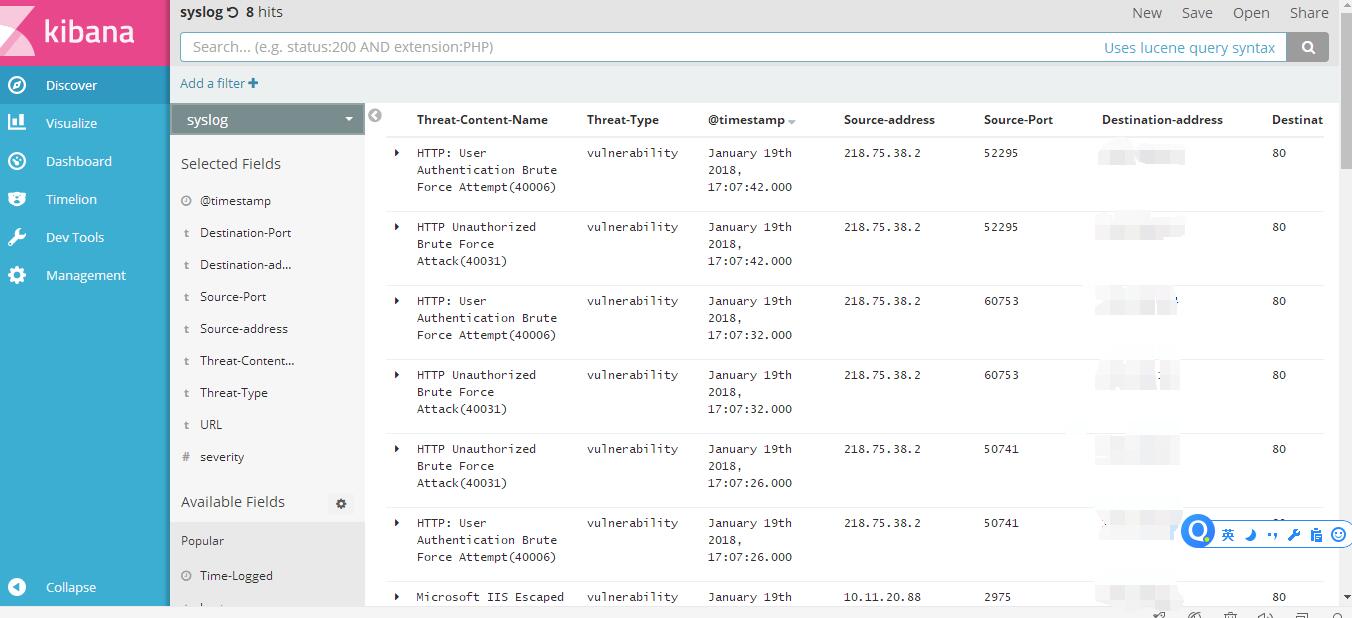
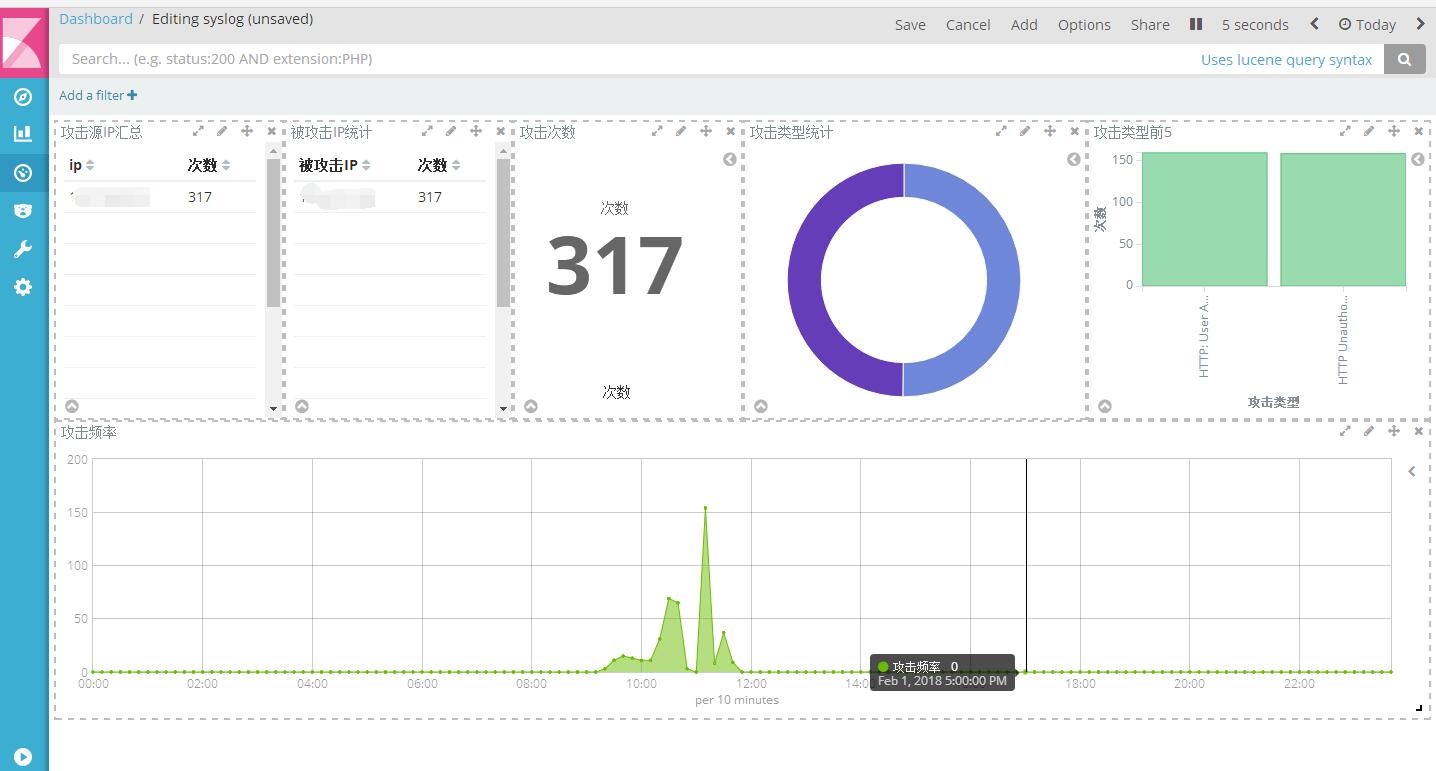
最终效果
4、elastalert设置
elastalert:https://github.com/Yelp/elastalert.git
钉钉告警:https://github.com/xuyaoqiang/elastalert-dingtalk-plugin
部分依赖:1
sudo apt-get install python-dev libffi-dev
1、安装过程如下:1
2
3
4
5
6pip install elastalert
或者
git clone https://github.com/Yelp/elastalert.git
cd elastalert
sudo python setup.py install
sudo pip install -r requirements.txt
其中有部分依赖可能安装错误,请单独下载安装既可。
2、安装完继续
在elasticsearch中创建elastalert的日志索引1
sudo elastalert-create-index --index elastalert
根据自己的情况,填入elasticsearch的相关信息,关于
elastalert_status部分直接回车默认的即可。
如下所示:1
2
3
4
5
6
7
8
9
10
11Enter Elasticsearch host: localhost
Enter Elasticsearch port: 9200
Use SSL? t/f:
Enter optional basic-auth username (or leave blank):
Enter optional basic-auth password (or leave blank):
Enter optional Elasticsearch URL prefix (prepends a string to the URL of every request):
Name of existing index to copy? (Default None)
Elastic Version:5
Mapping used for string:{'index': 'not_analyzed', 'type': 'string'}
New index elastalert created
Done!
3、创建配置文件
3.1、修改elastalert的配置文件
下载https://github.com/xuyaoqiang/elastalert-dingtalk-plugin,把其中的把elastalert-dingtalk-plugin中的elastalert_modules、rules和config.yaml复制到elastalert下
修改config.yaml对应配置1
2es_host: elasticsearch 地址
es_port: elasticsearch 端口
3.2、修改rules的配置文件
官方有很多rules规则可以去看官方文档:
http://elastalert.readthedocs.io/en/latest/ruletypes.html#rule-types
需添加必要的配置, 修改添加报警规则xxx.yaml,如:1
2
3
4
5
6
7
8
9
10
11
12
13
14
15
16
17
18
19
20
21
22
23
24
25
26
27
28
29
30
31
32
33
34
35
36
37
38
39
40
41
42
43
44
45name: IPS安全告警
#唯一值重复告警规则
type: cardinality
#es_host: localhost
#es_port: 9200
# Index to search, wildcard supported
index: syslog
#自定义的唯一值字段
cardinality_field: Source-address.keyword
#最小5次触发规则
min_cardinality: 5
#max_cardinality: 5
# 60秒内
timeframe:
seconds: 30
# 5 分钟内相同的报警不会重复发送
realert:
minutes: 5
# 指数级扩大 realert 时间,中间如果有报警,
# 则按照 5 -> 10 -> 20 -> 40 -> 60 不断增大报警时间到制定的最大时间,
# 如果之后报警减少,则会慢慢恢复原始 realert 时间
exponential_realert:
hours: 1
# ES 查询,用以过滤
#filter:
#- term:
# Severity: "high"
# (Required)
# The alert is use when a match is found
alert:
- "debug"
#你自己定义的钉钉告警脚本
- "elastalert_modules.dingtalk_alert.DingTalkAlerter"
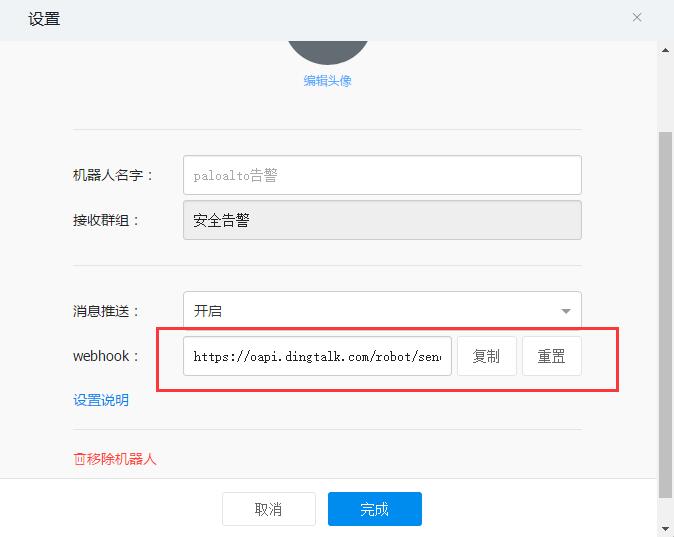
dingtalk_webhook: 在钉钉群中添加机器人可以获取
dingtalk_msgtype: "text"
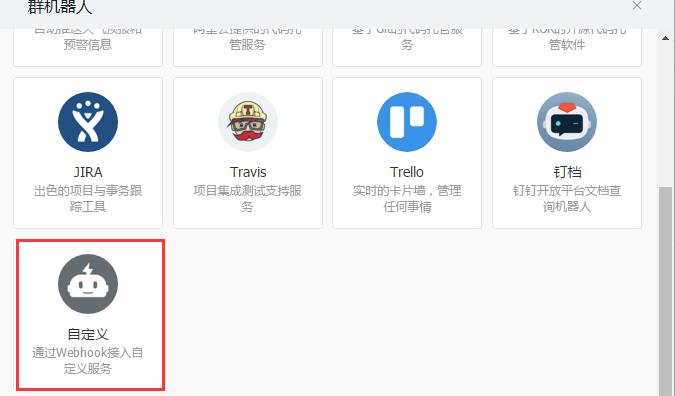
4、钉钉的配置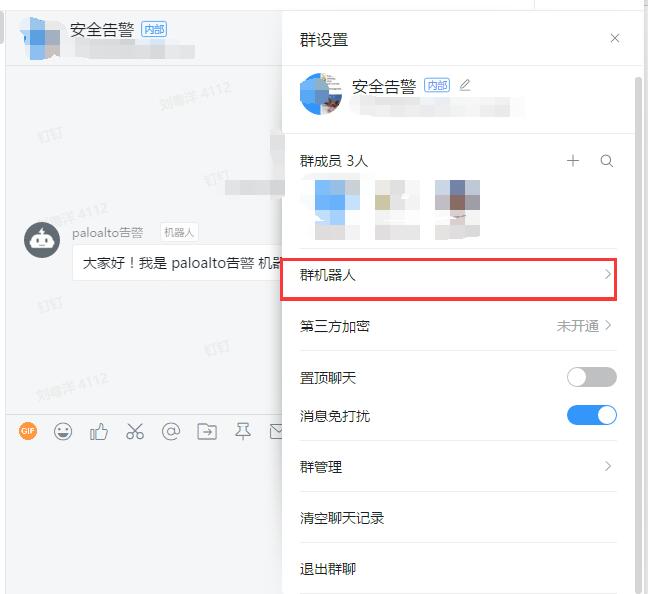
5、配置elastalert,变为自定义告警内容
5.1、启用钉钉的报警
原生告警比较不友好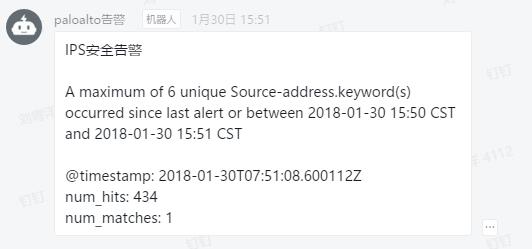
修改为: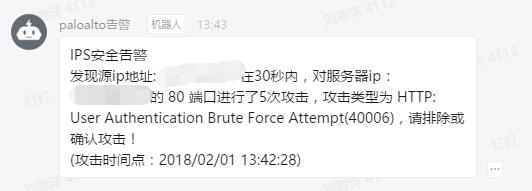
修改了elastalert-dingtalk-plugin-master\elastalert_modules\dingtalk_alert.py里面的代码,代码如下:
为了获取告警时间,然后对这个时间变为时间段,到es里面查询,获取对应的字段值,这个里的时间转换比较乱,代码写的渣,大佬可以忽略1
2
3
4
5
6
7
8
9
10
11
12
13
14
15
16
17
18
19
20
21
22
23
24
25
26
27
28
29
30
31
32
33
34
35
36
37
38
39
40
41
42
43
44
45
46
47
48# 获取对应时间段,并查询到对应可疑ip地址
get_time = body.split('\n')[4].split(' ')[1]
times = get_time.split('.')[0].split(':')[:2]
t = times[0]
t1 = int(times[1]) - 2
t2 = int(times[1]) + 2
# 将其转换为时间数组
timeStruct = time.strptime(t + ':' + str(t1), "%Y-%m-%dT%H:%M")
# 转换为时间戳:
timeStamp1 = int(time.mktime(timeStruct))
# 时间戳转换为指定格式日期
localTime = time.localtime(timeStamp1)
gt = time.strftime("%Y-%m-%dT%H:%M", localTime)
timeStruct = time.strptime(t + ':' + str(t2), "%Y-%m-%dT%H:%M")
# 转换为时间戳:
timeStamp2 = int(time.mktime(timeStruct))
# 时间戳转换为指定格式日期
localTime = time.localtime(timeStamp2)
lt = time.strftime("%Y-%m-%dT%H:%M", localTime)
# print(gt+'\n'+lt)
es = Elasticsearch("10.11.10.245:9200")
body = {
"query": {
"range" : {
"@timestamp" : {
"gt" : gt,
"lt": lt
}
}
}
}
res = es.search(index="syslog", body=body)
text = res['hits']['hits']
if len(text) != 0:
sip = text[0]['_source']['Source-address']
dip = text[0]['_source']['Destination-address']
dport = text[0]['_source']['Destination-Port']
atype = text[0]['_source']['Threat-Content-Name']
ntime = text[0]['_source']['Time-Logged']
payload = {
"msgtype": self.dingtalk_msgtype,
"text": {
"content": "IPS安全告警\n发现源ip地址: %s 在30秒内,对服务器ip:%s 的 %s 端口进行了5次攻击,攻击类型为 %s,请排除或确认攻击!\n(攻击时间点:%s)" % (sip, dip, dport, atype, ntime)
},
"at": {
"isAtAll":False
}
}
6、最后开启所有组件
1 | ./elasticsearch-5.5.2/bin/elasticsearch & |
至此大功告成,其实elk还可以接收各种日志,自己做分析,然后告警,本文只是其中一个场景,大家可以收集所有日志一起做集中告警。
谢谢各位大佬捧场。